Methodology
Following a proprietary methodology of data-backed analysis, the ETR Observatory Scope, unlike other industry reports, is designed to assess IT decision-maker (ITDM) usage of a vendor’s product and services within a specific subsector, and not the efficacy of the tools themselves. Our reports position subsector competitors relative to their peers based solely on ETR’s underlying data tracking spending, utilization, and depth or entrenchment within the ETR Community. Vendors are plotted on the infographic solely according to real data drawn from the ETR Community.
Backed by industry-leading survey data from a robust ITDM community, our ETR Observatory Scope positions enterprise technology vendors in relation to their subsector peers. Vendors are positioned in Leading, Advancing, Tracking, or Trailing groups according to Momentum and Presence in the market. These positions are determined based on the stated spending intentions of customers surveyed in the ETR Observatory survey. The plotting of the vendors in each subsector is based on the data, not opinions or vendor influence.
The more detailed accompanying Observatory report examines the full results from an individual Observatory survey, which collects information on each vendor from both current customers and recent evaluators of each vendor. This survey collects insights on spending intentions, likelihood to recommend a vendor, relative strengths and weakness of each vendor, and the most valued features for products in each subsector, among other things. The final Observatory Report represents a consolidated industry analysis by our research staff, drawing primarily on the Observatory surveys, while also triangulating data from ETR’s TSIS, ETS, commentary from ETR Insights Interviews with ETR Community members, and proprietary industry analysis by our research staff.
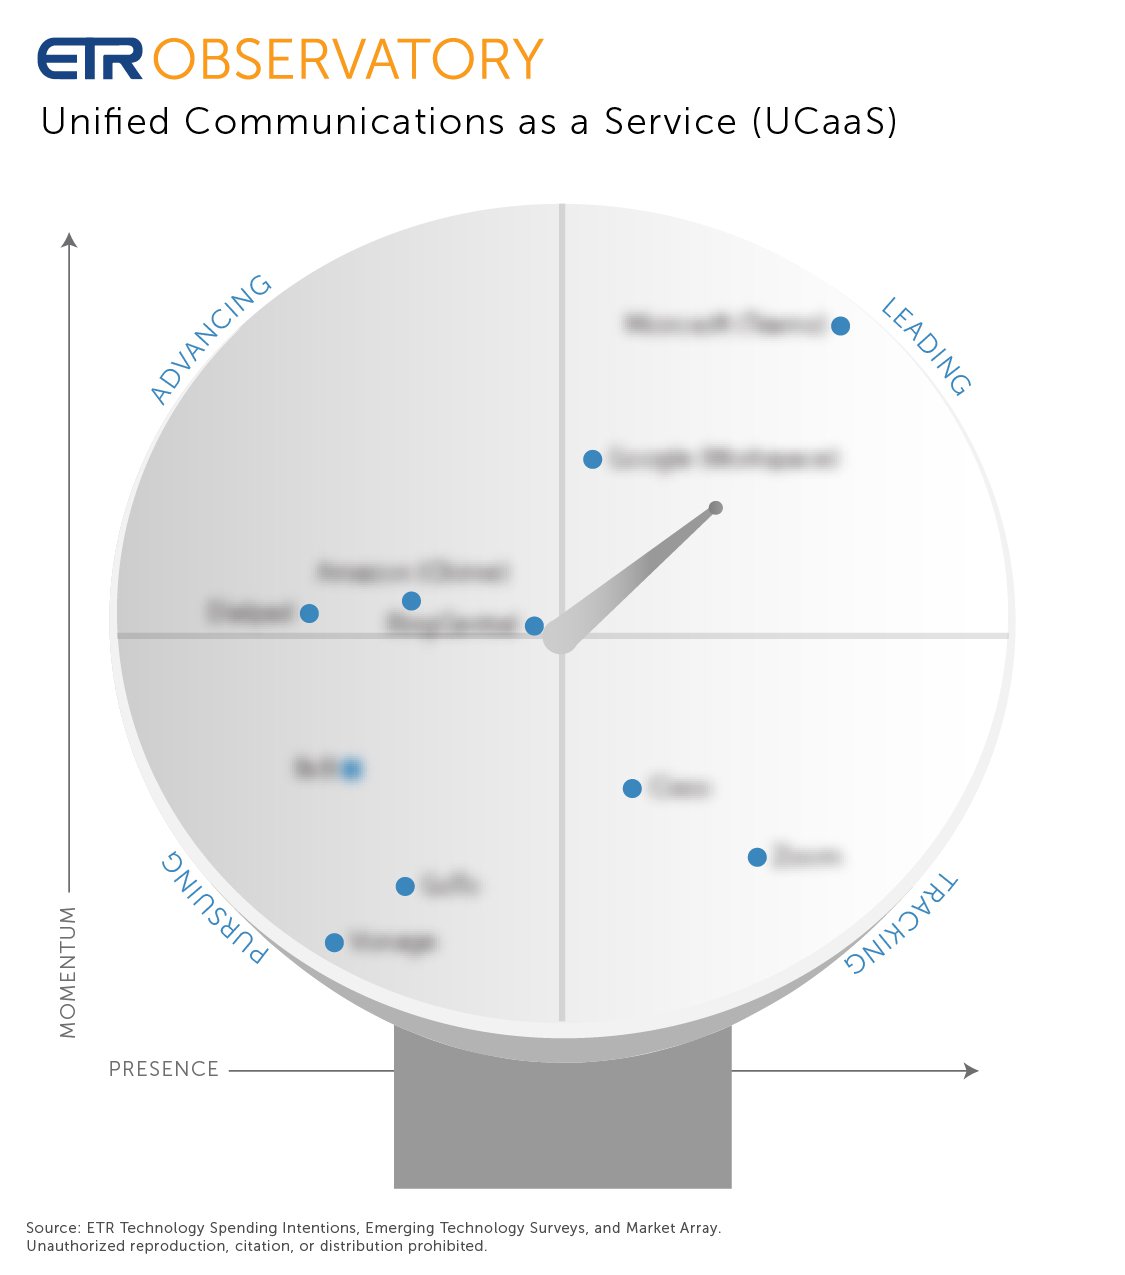
The Observatory Scope Infographic
The Observatory Scope Infographic
The y-axis of the Observatory Scope represents the vendor’s overall Momentum within the subsector as based on stated spending intentions among current customers surveyed in the latest Observatory survey.The x-axis represents the vendor’s overall Presence within the ITDM respondent population, as measured as the share of total survey respondents who indicated they are currently using the vendor in the latest Observatory survey.

The two axes are used to plot the subsector vendors within four groupings: Leading, Tracking, Trailing, and Advancing vendors. In the top-right grouping, Leading vendors are showing both strong Momentum and Presence. Inversely, the lower left grouping of Trailing vendors indicates both low Presence and Momentum relative to the other subsector peers. Advancing vendors (in the top left) are capturing strong Momentum within our enterprise ITDM population but do not yet have a high level of Presence. Lastly, the Tracking vendors are well established with widespread Presence but lower levels of Momentum. This category is often where mature vendors ultimately settle.
Observatory Scope Methodology
Observatory Scope Methodology
Momentum is a measure of a vendor’s spending and utilization, analogous but not identical to Net Score (TSIS) Respondents who indicated they are currently using a vendor/product indicate if their spending for that vendor is increasing, flat, or decreasing, if they recently adopted the vendor for the first time, or if they plan to replace the vendor entirely. Respondents indicating increasing or adoption are coded +1, flats are code 0, and those decreasing or replacing are coded as -1. The average of these coded responses is then passed to a logarithmic scaling function to emphasize relative differences over absolute differences in the final graphic.
Presence is a measure of a vendor’s penetration within its subsector in our survey work and is analogous but not identical to Pervasion (TSIS)calculations. Presence is calculated as the number of survey respondents currently using a vendor divided by the total number of survey respondents. This ratio is then passed through a logarithmic scaling function to emphasize differences between smaller vendors and deemphasize the difference between the largest and smallest vendors.
Back to Summary | About ETR | Key Terms | Methodology